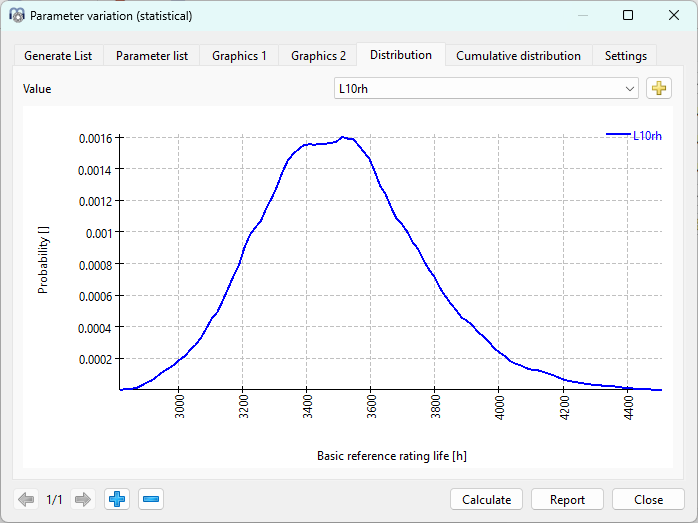
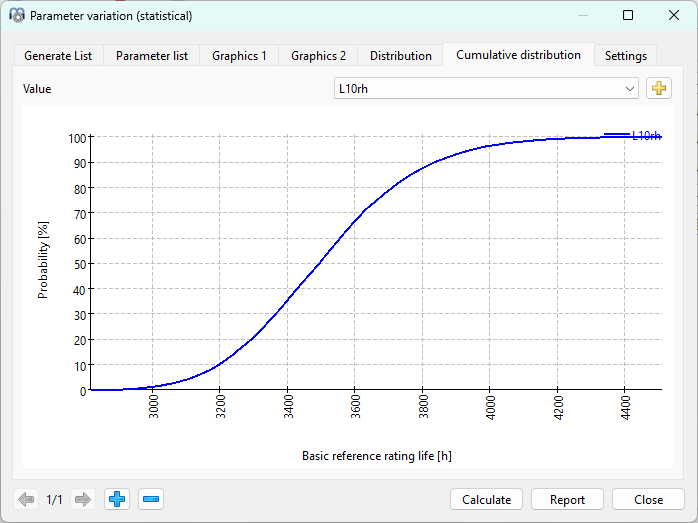
The probability distribution is graphically represented at the tab-page ‘Distribution’. By simply using the  -button, it is possible to make comparisons between different results. The cumulative distribution allows easily to find the valued for 50% or 90% probability for example.